Back to the root of meta-analysis: understanding sampling variance
A methodological COSSEE post focused on sampling variance and foundational ideas in meta-analysis.
Meta-analysis has become a cornerstone of evidence synthesis across disciplines, from medical research to environmental science. Thanks to modern software, conducting a meta-analysis is more accessible than ever. However, as our recent work on the quality of meta-analyses of organochlorine pesticides highlights (https://www.nature.com/articles/s41893-025-01634-5), accessibility does not always translate to quality. A key reason is that practitioners often overlook the statistical theories underpinning meta-analysis. In a series of blog, I aim to demystify these foundational concepts, starting with a common topic: sampling variance.
What is sampling variance?
Sampling variance is a fundamental concept in statistics, yet it is often misinterpreted in meta-analysis. When researchers talk about “sampling variance,” they usually mean the variance associated with effect size estimates from primary studies. However, the term is broader: sampling variance exists whenever we estimate any parameter; an effect size, an overall mean effect, a regression coefficient, or even a variance component such as the between-study variance (tau^2). In essence, sampling variance reflects the uncertainty that arises from random sampling. It quantifies how much an estimate would fluctuate if we were to repeat the study many times under identical conditions.
Sampling distribution and standard Error
To understand sampling variance, we first need to understand the sampling distribution. Imagine conducting a study with a sample size 𝑛 to estimate an effect size, such as the standardized mean difference (SMD) between treatment and control groups. If you could repeat this experiment many times (each time drawing a new random sample from the same population), you would obtain a distribution of SMD estimates. This is the sampling distribution of the SMD.
Deriving sampling variance: “ideal” vs. “practical” approaches
Ideally, to calculate the sampling variance of an effect size estimate, you would repeat a study with the same sample size (n) many times, compute the effect size each time, and then calculate the standard deviation of the resulting sampling distribution.
For example, to estimate the sampling variance of an SMD, you would: (i) Conduct the study multiple times with sample size (n). (ii) Compute the SMD for each study. (iii) Form the sampling distribution of SMDs. (iv) Calculate its standard deviation (the standard error) and square it to get the sampling variance.
Similarly, for the overall mean effect in a meta-analysis, you would: (i) Draw Randomly sample sets of studies many times. (ii) Fit an intercept-only meta-analytic model to each sample to estimate the overall mean effect. (iii) Form the sampling distribution of these mean effects. (iv) Calculate its standard deviation and square it.
This conceptual exercise shows what sampling variance means, but of course, repeating studies thousands of times is impractical.
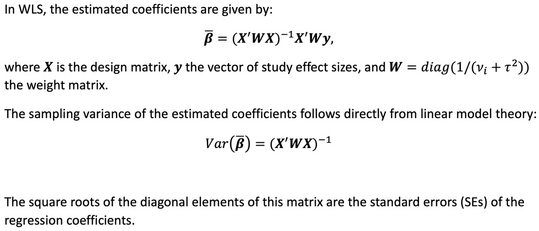
From concept to calculation: statistical theory as a shortcut